UberChart – WordPress Chart Plugin 1.35
Recently Updated
100% Original Product & Well Documented
Since 2022
1 sale
Version 1.35

GPL License
Original price was: $39.00.$3.99Current price is: $3.99.
- Verified from VirusTotal
- 100% Original Product and Virus Free.
- Free New Version Lifetime On Single Purchase.
- Unlimited Website Usage
- Price is in US dollars and included tax
Sale will end soon

SSL Secured Checkout


Verified From
![]()
![]()
- Products Are Purchased and Downloaded From Original Authors.
- The File is 100% Completely Untouched and Unmodified.
- Last Update: 22.July.2025
- Version: 1.35

Premium Membership
Download this product for FREE and also gain access to 5,000+ premium themes and plugins.

Secure Transaction
Your transaction is secure with Stripe, one of the most trusted payment gateways
Virus Free
All items on our website are virus-free and tested using VirusTotal
Timely Update
When the author releases a new update, we upload the latest version to our website
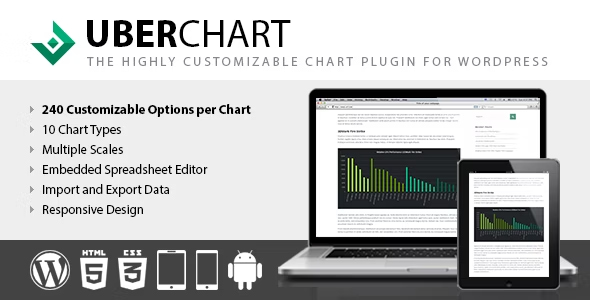
UberChart Latest Version
This is a GPL-distributed version. No official support. Clean, secure, and legally redistributed under the GPL license.
UberChart is an advanced WordPress Chart Plugin that gives you the ability to create a great variety of charts with exceptional customizability. With a total of 240 options per chart and 30 options per dataset, you will always be able to create exactly the chart you need.
Create your perfect chart with UBerChart Plugin
The available chart types are:
- Line Charts
- Area Charts
- Bar Charts
- Horizontal Bar Charts
- Pie Charts
- Doughnut Charts
- Radar Charts
- Polar Area Charts
- Scatter Charts
- Bubble Charts
After you select the chart type you can start with the customization, check out this screenshot of the Charts Menu with all the sections opened to have an idea of the extremely high number of available options.
GENERAL OPTIONS
These options are used to define the general behavior of the chart and the aspect of some of the elements of the chart (datasets and scales have their own customization options, see the specific sections for details), for example, you can:
- Set the chart size, margin and background-color
- Enable or disable the responsiveness of the chart
- Select the speed and the type of animation
- Set size, color, font family, font style, and position of the chart title
- Set size, color, font family, font style, and position of the text in the chart legend
- Set the style of the tooltips
DATASETS CUSTOMIZATION
You are free to decide how each dataset of the chart should appear, for example, you can:
- Define the bezier curve tension of each line, this allows you to represent straight or curved lines
- Define the width of each line, create dashed lines with custom gaps and also select the lineup and line join canvas properties of each line
- Set the point style of each point (circle, triangle, rectangle, cross, line, star, dash, and more)
- Select how each point should react when hovered, for example, you can define the exact radius that reacts to the hover mouse event
- Set the radius, the border, and the background color of each point or bubble (in both hover and default status)
- Set the background and border color of every single bar displayed in a bar chart (in both hover and default status)
- Set the background and border color of each arc displayed in a Polar Area, Pie, or Doughnut chart (in both hover and default status)
Add a review
Currently, we are not accepting new reviews
Top Selling
Version 4.2.1

Original price was: $400.00.$3.99Current price is: $3.99.
2261 sales
Version 28.0

Original price was: $99.00.$3.99Current price is: $3.99.
831 sales
Version 3.23.1

Original price was: $249.00.$3.99Current price is: $3.99.
586 sales
Version 3.0.18
Original price was: $129.00.$3.99Current price is: $3.99.
543 sales
Version 8.5.6

Original price was: $59.00.$3.99Current price is: $3.99.
490 sales
Version 4.13.6

Original price was: $59.00.$3.99Current price is: $3.99.
377 sales
Version 8.2.2

Original price was: $99.00.$3.99Current price is: $3.99.
254 sales
Version 12.7.7

Original price was: $59.00.$3.99Current price is: $3.99.
249 sales
Related products
Version 2.32.0

Original price was: $89.00.$3.99Current price is: $3.99.
15 sales
Version 4.15.0

Original price was: $79.00.$3.99Current price is: $3.99.
19 sales
Version 7.15.6

Original price was: $69.00.$3.99Current price is: $3.99.
159 sales
Version 1.9.15

Original price was: $99.00.$3.99Current price is: $3.99.
37 sales
Version 2.3.2.1

Original price was: $39.00.$3.99Current price is: $3.99.
5 sales
Version 5.0.8

Original price was: $99.00.$3.99Current price is: $3.99.
58 sales
Version 3.23.1
Original price was: $249.00.$3.99Current price is: $3.99.
586 sales
Version 4.28.0
Original price was: $66.00.$3.99Current price is: $3.99.
20 sales
Version 1.12.15

Original price was: $199.00.$3.99Current price is: $3.99.
27 sales
Version 4.5.4

Original price was: $49.00.$3.99Current price is: $3.99.
13 sales
Version 4.38.0
Original price was: $69.00.$3.99Current price is: $3.99.
10 sales
Version 4.27.5

Original price was: $89.00.$3.99Current price is: $3.99.
19 sales
Version 4.0

Original price was: $49.00.$3.99Current price is: $3.99.
105 sales
Version 1.3.8
Original price was: $49.00.$3.99Current price is: $3.99.
0 sales
Version 3.20.8

Original price was: $59.00.$3.99Current price is: $3.99.
208 sales
Version 4.22.1
Original price was: $99.00.$3.99Current price is: $3.99.
13 sales
Version 12.7.7
Original price was: $59.00.$3.99Current price is: $3.99.
249 sales
Version 2.0.1

Original price was: $22.00.$3.99Current price is: $3.99.
6 sales
Version 1.53.0
Original price was: $59.00.$3.99Current price is: $3.99.
4 sales
Version 2.20.0
Original price was: $59.00.$3.99Current price is: $3.99.
9 sales
Version 3.7.0

Original price was: $59.00.$3.99Current price is: $3.99.
134 sales
Version 4.2.1
Original price was: $400.00.$3.99Current price is: $3.99.
2261 sales
Version 2.3.0

Original price was: $49.00.$3.99Current price is: $3.99.
69 sales
Version 3.1.0.1

Original price was: $18.00.$3.99Current price is: $3.99.
4 sales
Sorry, no reviews match your current selections
WINTER SALE OFFERS • GET 25% OFF ON 1 YEAR & LIFETIME MEMBERSHIP USE COUPON CODE: SPECIALDISCOUNT25 • BUY TWO GPL PRODUCTS AT JUST $6 USE COUPON CODE: BUY2 • GET 25% OFF ON 1 YEAR & LIFETIME MEMBERSHIP USE COUPON CODE: SPECIALDISCOUNT25 • BUY TWO GPL PRODUCTS AT JUST $6 USE COUPON CODE: BUY2 • GET 25% OFF ON 1 YEAR & LIFETIME MEMBERSHIP USE COUPON CODE: SPECIALDISCOUNT25 • BUY TWO GPL PRODUCTS AT JUST $6 USE COUPON CODE: BUY2 • GET 25% OFF ON 1 YEAR & LIFETIME MEMBERSHIP USE COUPON CODE: SPECIALDISCOUNT25 • BUY TWO GPL PRODUCTS AT JUST $6 USE COUPON CODE: BUY2 •


Reviews
There are no reviews yet